Analysis: Role "mains"

Intro

I’m using this topic to continue a discussion started in this post, where I answered the question “What is the average TrueSkill rating of a carry, captain and jungle main?”:

I want to combine it with the results of a discussion on Discord about players’ main roles.

What is a main, mathematically?

We are going to look at a sample of players from VainSocial who played at least 20 ranked matches.

Facts

Here you can see how commonly a player picks a role. One would assume that there are as many captain mains as there are jungle or carry mains and that the majority of players plays all three roles about 33% of the time.

Nope.

On the right side are the most dedicated players. About 188 players play captain 90% of the time for example, which means that they play carry or jungle 10% of the time. Any player that is a captain main is not a carry or jungle main at the same time. Likewise for carry or jungle mains.

Oddly enough, the 3 curves do not perfectly fit onto each other. The captain peak is shifted to the left and the curve is higher on the right extreme.
That means that captain is less common to be played by someone who plays “flex”, and that there are twice as many hardcore captain mains as there are pure carry or jungle mains.

A possible explanation for that is that there are two stereotypes of players: “captain mains” and “damage mains”. A damage main switches between carry and jungle, but rarely plays captain. See below.

Interpretation

Let’s divide players equally into two categories: flex pickers and mains.
A flex picker is in the middle of the 3 curves. A main occupies space in the right (main role) and the left (other roles) area.

maths

I summed all 3 graphs, used relatives, and applied a regression.
I used x^4, it fits close enough. X is pick rate, Y is relative amount of players with that pick rate.
f(x) = -1.73 x^4 + 5.11 x^3 - 5.01 x^2 + 1.60 x^1 + 0.04

Now we want to divide the areas like this

  • A1 below the graphs at 0% <= x <= x_a1 belongs to the mains
  • A2 below the graphs at x_a1 < x <= x_a2 belongs to the flexers
  • A3 below the graphs at x_a2 < x <= 100% belongs to the mains
    We want to divide 50/50 into mains/flexers so A1 + A3 = A2.
    The same player who mains a role does not pick two other roles, so A3 = 2*A1.

wolframalpha helps:

F(x) = -0.346 x^5 + 1.278 x^4 - 1.67 x^3 + 0.8 x^2 + 0.04x + c

A1 = F(x_a1) - F(0) = F(x_a1) - c
A2 = F(x_a2) - F(x_a1)
A3 = F(1) - F(x_a2) = 0.102 + c - F(x_a2)

A1 + A3 = F(x_a1) + 0.102 - F(x_a2)

A1 + A3 = A2
A3 = 2 * A1
=> 3A1 = A2

*1:
A2 = A1 + A3
<=> F(x_a2) - F(x_a1) = F(x_a1) - F(x_a2) + 0.102
<=> 2 F(x_a2) = 2 F(x_a1) + 0.102
<=> F(x_a2) = F(x_a1) + 0.051


*2:
A1 + 2A1 = A2
=> F(x_a2) - F(x_a1) = 3 F(x_a1) - 3c
<=> F(x_a2) = 4 F(x_a1) - 3c


*1 and *2:
4 F(x_a1) - 3c = F(x_a1) + 0.051
<=> 3 F(x_a1) - 3c = 0.051
<=> F(x_a1) - c = 0.016999
=> x_a1 = 0.139045


*1 again, we need x_a2
F(x_a2) = F(x_a1) + 0.051
=> F(x_a2) - c = 0.016999 + 0.051
<=> F(x_a2) - c = 0.067999

0 <= x_a2 <= 1, so:
x_a2 = 0.410716

As demonstrated, mains’ two non main roles are between 0% and 14% pick rate on average, and their main roles are between 41% and 100% pick rate.
Flexers’ pick rates averages are between 14% and 41%.

Therefore, any player that picks a role 41% the time or more mains that role according to the given definition. Logically, a player can main two roles at the same time.

More in this post: Analysis: Role "mains" - #13 by shutterfly

Distribution of mains by tiers

The relative majority of captain mains is between tier 5 and 7.

See also @TheCopyCat’s article: What’s Your Role in 5v5? - Google Docs

Mains and their rankings

A month ago, we split TrueSkill - which originally was our match maker rating for both casual and ranked - into a ranked TrueSkill, a casual TrueSkill, Blitz TrueSkill, … and a TrueSkill shared between all modes (which is used internally for placement and analysis). Since what I wrote in the article linked in the introduction used the TrueSkill shared between all modes, I’ve done the same analysis again with our ranked TrueSkill and the average skill tier.

This time, we are going to use 41% pick rate to qualify for a “main” and look at players from tier 7 and above.

  • carry: 1 391 players
  • captain: 1 343 players
  • jungler: 1 480 players

  • carry: tier 8.94
  • captain: tier 8.84
  • jungler: tier 8.8

  • carry: ranked TrueSkill 2 230
  • jungler: ranked TrueSkill 2 117
  • captain: ranked TrueSkill 1 966

TrueSkill is only based on win/loss, your own, ally and enemy ratings. It is not an algorithm we have developed, it is from Microsoft Research: Microsoft Research / TrueSkill Rating System

As before, carry mains’ ratings are the best using both rankings.
Surprisingly though, the average skill tier of a captain main is above a jungler main’s - while the TrueSkill is lower.
Is that correlation or causation (Wikipedia / Correlation does not imply causation)?
Are carries better or are better players just carries by chance?

I will stop the analysis here because I do not have any more answers or theories yet.

Edit 2018-02-08: Added link to “hardcore main” / “two role flex” analysis, corrected grammar

12 Likes

Very good read, as someone who splits their roles equally.

This is really fascinating to read through, thanks for posting it!

Can you help me understand why 41% is the cut-off for a main?

@HipsterSkaarf It’s a little hidden right in the middle of OP

No, I see that bit - I’m just missing the rationale for those numbers. Sorry, feeling pretty dense. Feel free to tell me to go back and read it again though, if I should be understanding.

Thank you for sharing this. Very insightful information.

As if we didn’t already know everyone hates captain :ringo:

AHEM clears throat

I am a proud Lance main

Eww you main? If you’re not fill then what even are you?

So they set x_a2 < x <= 100 to determine what pick rate determines “main”. Pretty much, they used some fancy formula (i’m not going to pretend to understand more than the gist) to determine what x_a2 is equal to. They found that it equals 0.410716, or 41%, which means people who pick a role 41.0716% - 100% of the time are they main they chose.

tl;dr of the math:

I want to divide players into 50% flex, 50% main.
A main for example plays 80% captain + 20% other = 100%.
A flex for example plays 30% captain + 30% carry + 40% jungler = 100%.

The area below a graph is how many players there are.
In order to split into two equal groups, I look for the flex area in the middle to have as many players in it as the “neglected role” area on the left and the “main role” are on the right combined.

Maybe there is a better approach, but higher pick rate thresholds do not change the results much. With a threshold of 60% you split the player base into more like ⅔ flex and ⅓ main which gives you an overproportional amount of captain mains in statistics.

Cool, thanks guys! I haven’t mathed in ages, so I’m still getting my head around what behavior the numbers are describing. It helps seeing the results of a higher threshold, and helps support the idea that the split is between captains and damage dealers, rather than between captain, carry, and jungle evenly.

1 Like

Yesterday, I posted a theory about mains and flexers:

Today I took view at the data from a different angle and can prove this interpretation now. This is from tier 7+ players with at least 20 ranked matches again.

players tier and average ranked trueskill by mains/flexers

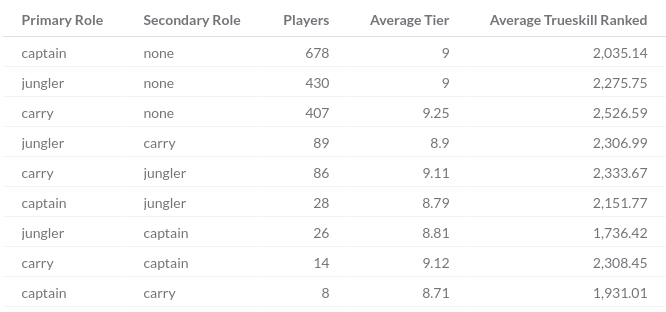
The first 3 rows are “hardcore mains”, which are players who pick one role over 100% - 41% = 59% of the time. They pick their favorite role so often that they cannot main a second role (because “main” starts at 41%).

The next 6 rows are “two role flex mains”. A player picks two roles between 41% and 59% of the time. They alternate between two roles but never play the third.

Most players fall into the “hardcore main” category because the interval 59% - 100% is significantly larger than 41% - 59%.

As you can see, damage mains are the vast majority of two role flex mains, being twice as many as captain + X flex mains in numbers. The second most popular combination are “walking through the jungle” mains. Very few players are captain + carry mains.

Carries in general take the lead in the skill tier ranking. Carry as primary role + X is similarily successful.
Players with captain as their primary role are the lowest in the ranking.
The most successful players do not main two roles at the same time and stick to one.

Since we’re talking statistics I think a Poisson distribution would fit better, but that’s details. The curve itself isn’t smooth enough that it would matter, anyways.

Otherwise, very interesting read.

1 Like

My hypothesis is because mechanically skilled players gravitate towards roles that are necessary to win.

In 3v3 the laner generally had the most impact on the overall game because the role directly effected the turrets which were the secondary objective.

If captain roles influenced the game as much as the carry position we would see a abundance of mechanically skilled players in that role.

It’s the same with every game. The top players will always favor the roles and characters that provide the greatest win conditions.